

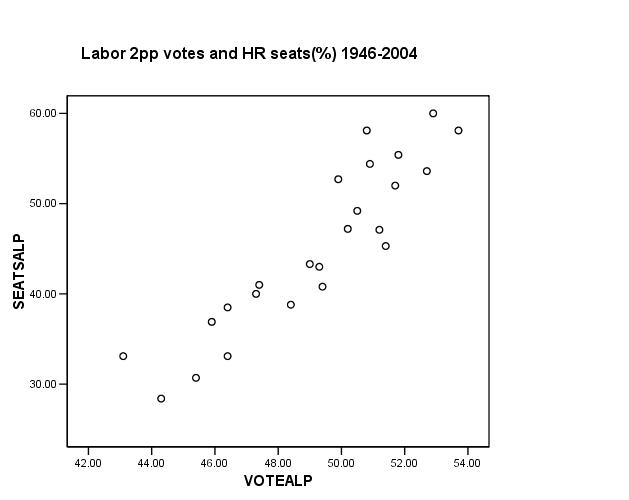
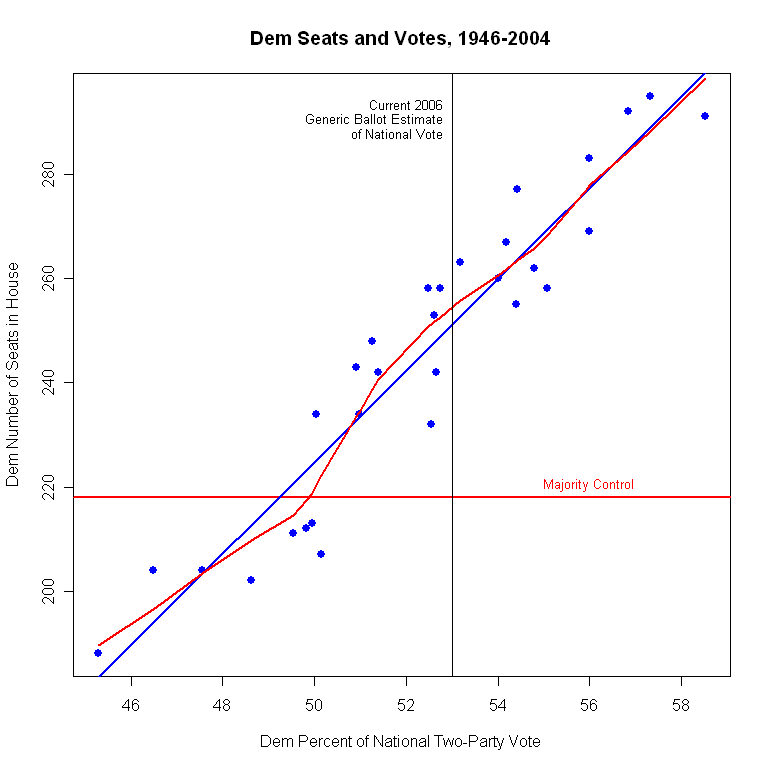
Fascinating analysis of the relation between overall party support and seats won in the US Congress on Charles Franklin’s Political Arithmetik. In Australia the divergences between votes and seats won are the subject of intermittent controversy. Labor has sometimes (more often than the conservatives) won a majority of votes but not a majority of seats. On some estimates during the 1949-72 era of uninterrupted Liberal-Country coalition government Labor won a majority of votes three times. In this US case it is sometimes argued that all electorate contests are individual and unique and that it makes little sense to speak of a national vote. But polls are taken on the 'generic' vote and for months have shown the Democrats at least 10% clear. The Australian evidence would suggest that any election with a 55:45 split means a landslide majority in seats. Franklin shows how final overall democrat votes tend to be less than the generic votes recorded in polls. Why? Are these Democrat identifiers recording a personal vote for popular Republican incumbents? Then there is the Australian question of the relation between votes and seats. Franklin has a graph of the relation between Democrat votes and seats 1946-2004. I have done this for Australia using the two-party preferred Labor vote; this was not counted before 1984 so I have used the estimates here and seat percentages from here. The two graphs are not that different. Interesting, obviously weird and wonderful outcomes do occur in individual American electorates but overall these tend to cancel each other out. Note also that the Democrats do better at converting votes into seats, slightly over 49% of votes give them 50% of seats but in Australia a 50% Labor vote yields only 47.5% of the seats.

2 Comments:
Two questions, Geoff.
How does preferential voting affect all this? If we look at the UK experience, am I right in thinking that preferential voting narrows gaps?
And am I right in thinking that the law of numbers comes in as well? Again my impression is that variances in Australia are much greater at State level.
Cheers
Jim Belshaw
Good points> I think the American figures are out of the combined Democrat+Republican voite rather than all votes but in the US this should be close to 100. Preferenterial voting would make little difference in Australia over 1946-2004 as both Labor and the Colition have benefitted over this time from preferences, DLP on one side, Greens on the other. Indivdual seats vary more at state level but overall they average out.
Post a Comment
<< Home